Helping people with everyday data visualizations
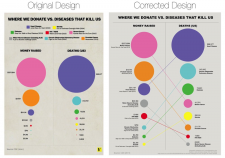
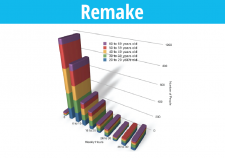
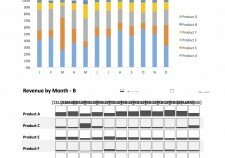
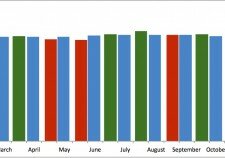
Column Chart, Excel
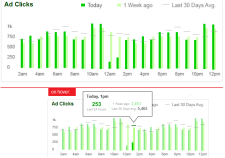
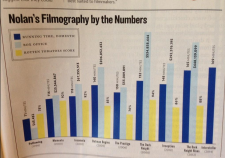
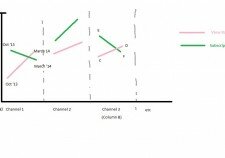
Column Chart, Excel, Line Chart
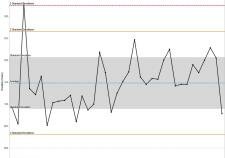
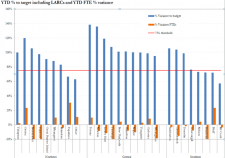
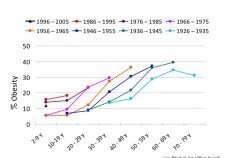
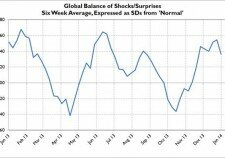
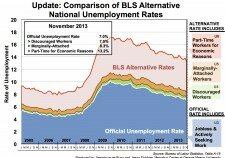
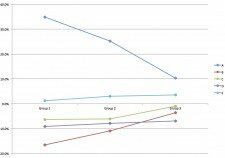
Line Chart
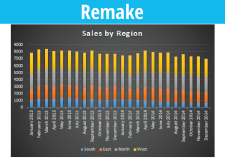
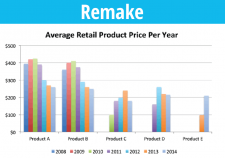
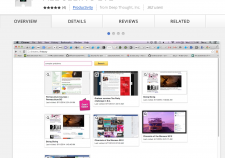
Remake Gallery
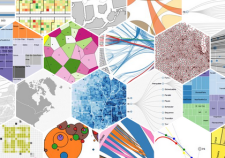
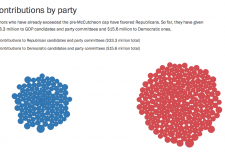
d3, Tree Diagram
Column Chart
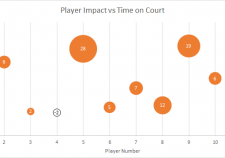
Bubble Chart, Scatterplot
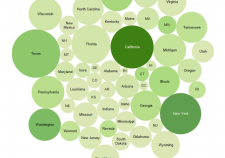
Bubble Chart, d3
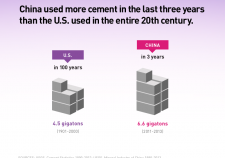
Unit Chart
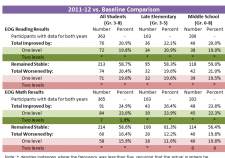
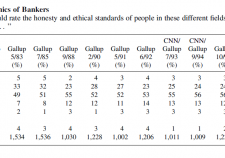
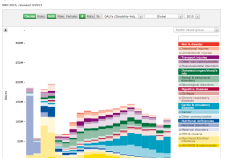
Excel, Table
Hackathon
App
Moderator
Bubble Chart, Tableau
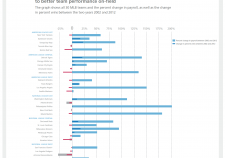
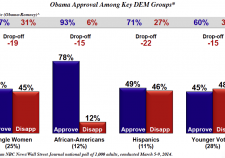
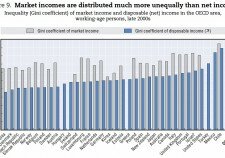
Bar Chart, Excel
Bar Chart, Excel, Illustrator
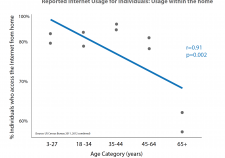
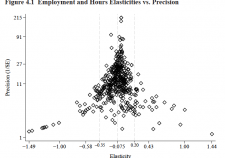
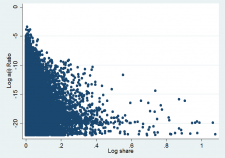
R, Scatterplot
Interactive, Unit Chart
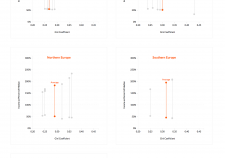
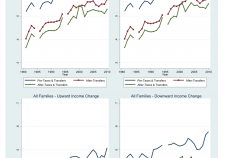
Excel, Line Chart, Small Multiples, Stata
Table, Uncategorized
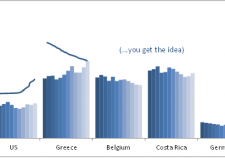
Bar Chart, Excel, Small Multiples
d3, Interactive, Unit Chart
Excel, Interactive, Line Chart
Blog Post, Bubble Chart, Excel
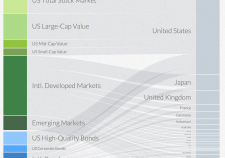
Sankey
Excel, Line Chart, Slope Chart
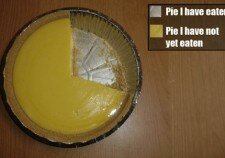
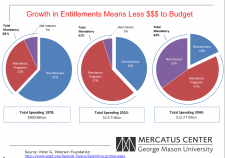
Pie Chart
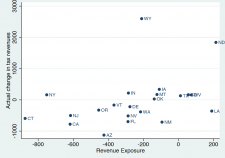
Excel, Scatterplot
Scatterplot, Stata
Excel, Unknown
Line Chart, Map, Tools
Pie Chart, PowerPoint
Area Chart, Excel
Column Chart, Interactive
Bar Chart, Excel, Line Chart
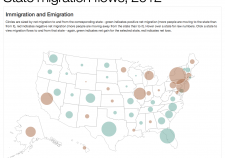
Choropleth Map, Map
d3, Interactive, Map
Bubble Chart
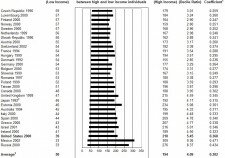
Bar Chart, Excel, Table
Projects for which we have already created data visualization