Charting Player Impact vs Time on Court
Over on PolicyViz.com, Mynda Treacy from MyOnlineTrainingHub wrote a guest blog post about visualizing basketball data. Mynda writes about and teaches Excel skills, ranging from number formats to chart types to VBA code. In her PolicyViz post, Mynda walks through her process for creating a better visualization of this data, but we thought it would be interesting to open it to comment and feedback from the HelpMeViz community. If you want to see where Mynda ends up, please see the post on PolicyViz; if not, have a go at the data available here in Excel format.
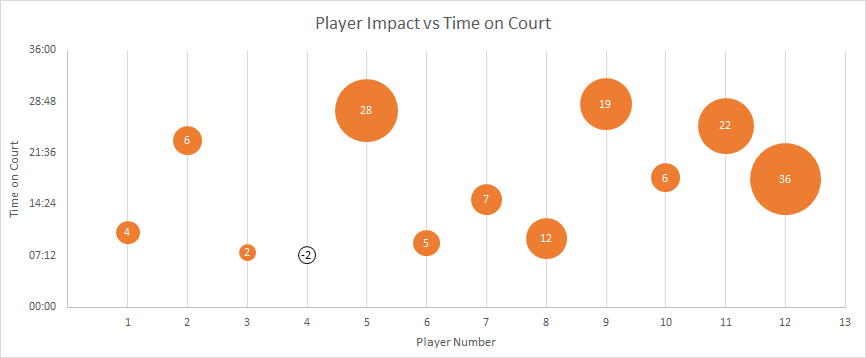
The data show the amount of time spent on the court and a measure of impact for 12 basketball players. The Impact variable is the sum of points scored for the team minus the points scored against the team while that player was on the court. An overall positive impact means the team scored more points ‘for’ than ‘against’ while that player was on the court. One limitation of Impact is that it doesn’t take into consideration the other players on the court at the same time.
The question is: Which players are most effective?
One thought on “Charting Player Impact vs Time on Court”