Trying to Fix “The Fix”
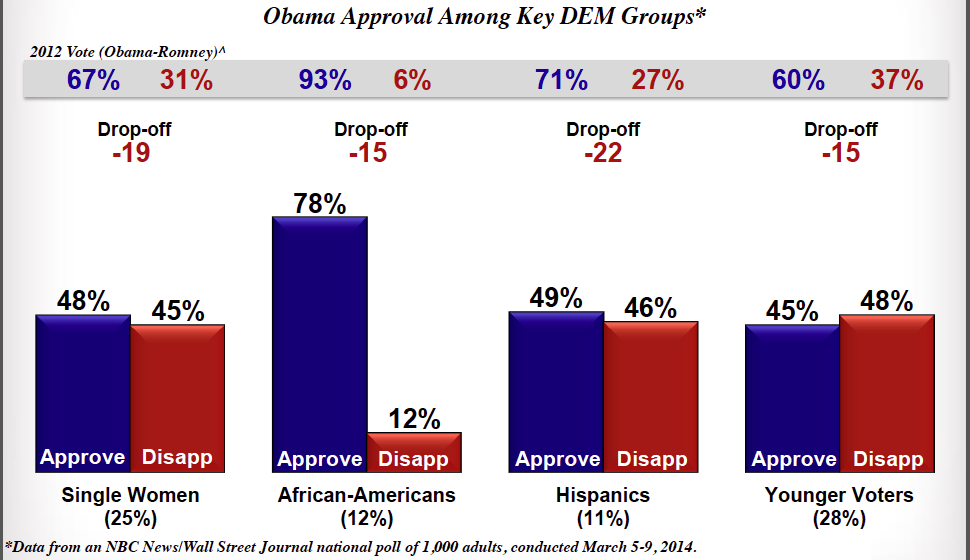
Over on PolicyViz, I wrote a post about this graph from The Fix at the Washington Post. I’m not a fan of the graph namely because the focus of the article was about the change in approval ratings between 2012 and 2014, but the visual does little to show that except for the “Drop-off” text. In the PolicyViz post, I showed a number of revision options–a few are shown below–but I don’t love any of them, so I thought I would see what the HelpMeViz community might do with it. The Excel file I used to create my variations can be found here.
Thanks,
Jon
I’d offer this “stacked” bar chart as an alternative.
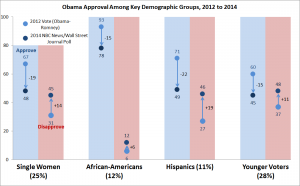
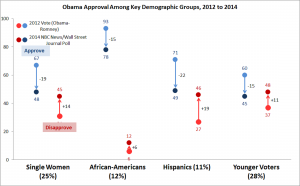
Here is another alternative with small multiples of slopegraphs.
I don’t like comparing vote results with approval ratings (see my comment on PolicyViz site), so here’s an idea with only approval ratings data (from Gallup), but with not quite the same groups due to my laziness in tracking down better data. (OK for me to be lazy but not for the Post!)
The “Other???” category is not correct but would be the voters not in other groups with the idea of confirming that Obama isn’t going down in some groups but making up for it elsewhere. Not sure if the line width idea is worth it. I decided to just show approvals and not disapprovals. The latter are almost mirroring the approvals and not so pertinent to the story. If the were broadened to, say, showing that approvals are down and disapprovals and up less and second chart for disapprovals can be shown.
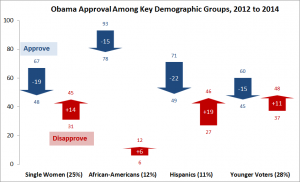
Regarding the other efforts, I find the alternating up and down arrows make it harder to quickly grasp the message. The shaded backgrounds do help by linking the pairs of arrows. I like both of Kyle’s efforts. The bars took a little effort to figure out; it may help if the order of colors in the legend mirrored the order in the graph.
Thanks, all.
@Kyle: I like the slope graph approach. I might somehow also incorporate the delta as a data label somewhere. I’m less inclined to use the horizontal bar charts: I think it’s harder to see the change in that layout, something I think my arrow charts suffer from as well.
@Xan: I agree with you about the data disparities here and they should have been addressed in the original post. I think one advantage of showing both the approvals and disapprovals is that the two don’t sum to 100%, so in the abstract there’s some possibility that the patterns wouldn’t exactly mirror each other. That doesn’t seem to be the case here, but worth thinking about more generally.
I like the sloped bar to illustrate decline in approval ratings.
This alternate stacked bar graph shows both changes in approval and disapproval ratings, and illustrates the distribution across the whole population. It also highlights the relatively large numbers of people who had no response (I presume that’s what the delta between approval and disapproval is for 2014) which in itself is interesting to see across groups in 2014.