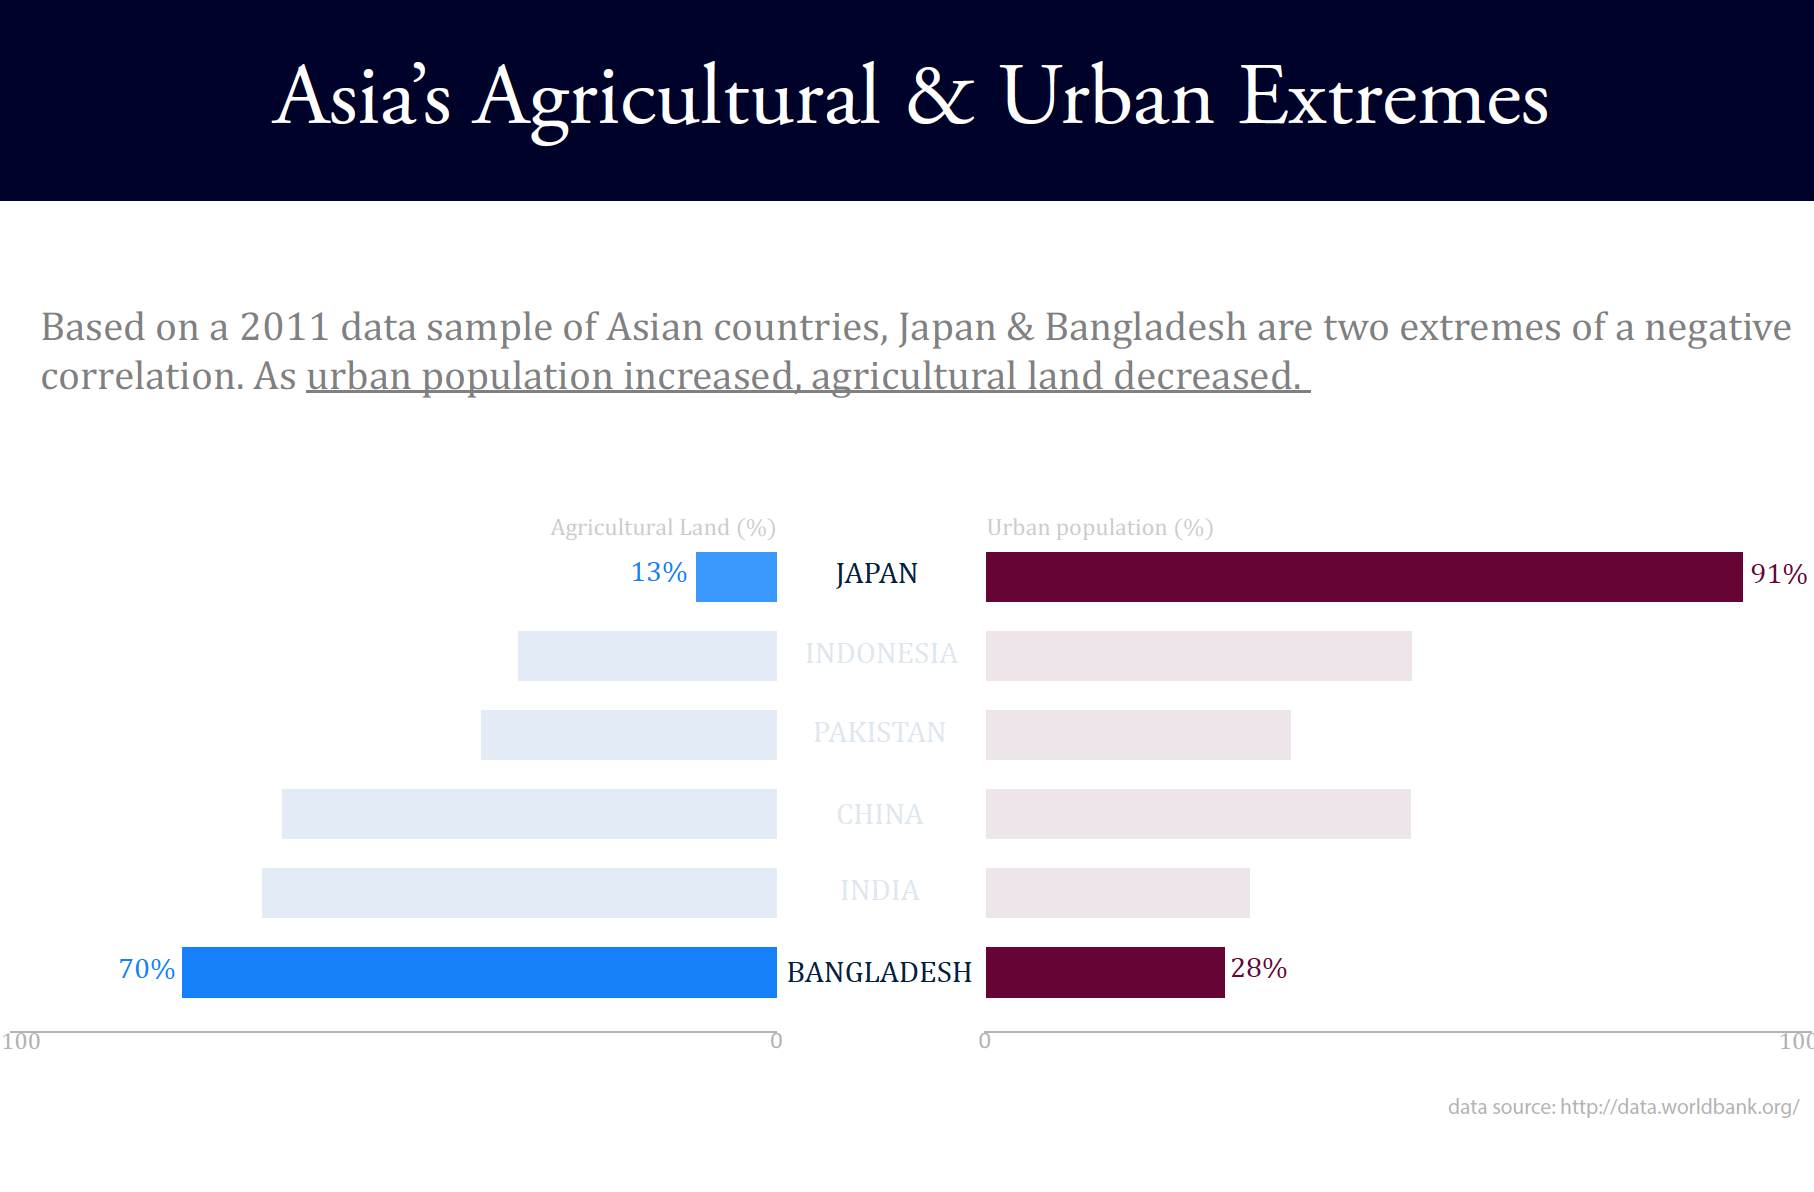
Urban, Population, Agriculture, and Land
I’m interested in the relationship between a country’s urban population (as percent of total) and the share of the country’s land in agriculture. In this World Bank data, I wanted to focus on some of the interesting outliers I discovered. For a specific visualization, I wanted to show quantitative and categorical values side by side. I also considered a map and how it might help tell the story. In the end, I created a horizontal bar chart tool in Excel and then transformed them into a back-to-back bar charts using Illustrator. For colors, I highlighted the outlier data with bold colors to stand-out against the other listed countries.
I would be curious to see that the R coefficient of two parameters for all the countries sampled here. Also, if Japan and Bangladesh are outliers, what is the relationship between the rest of the countries?
Great questions! I also wonder about each countries’ land mass and how that might effect the outcome of urban vs. agricultural land.
I like the design of this graph, and the different intensities of the colors really do guide the eye. The country labels for the other countries are a little difficult to read, though. You note that Bangladesh and Japan are two extremes or outliers, and that appears to be the story here. It might add to the story to provide some quantity of this divergence. Just a side note/question: were these the only countries you had data for? If not, how did decide the countries to include?
No – there were 4 other countries that represented different regions. But I thought it was weird that those six countries made up my sample. So, I decide to tell a story around those six. I could have shown all 10.
I also think it would be very interesting to see how land mass factors into the analysis, and how mechanized and automated agriculture is for some countries.
Assuming that ‘agricultural land’ is land that is actually being cultivated, tracking the rural to urban population movement vs. change in agricultural land over time (a timeline) might reveal if both indicators are correlated and if that change has happened more or less simultaneously.