Helping people with everyday data visualizations
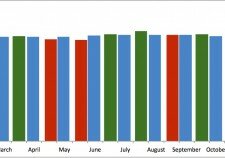
Column Chart, Excel
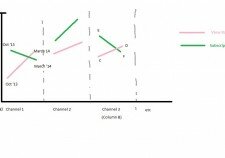
Column Chart, Excel, Line Chart
Excel, Table
Bar Chart, Excel
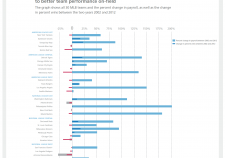
Bar Chart, Excel, Illustrator
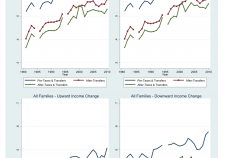
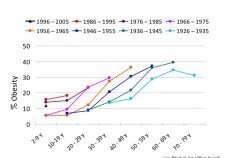
Excel, Line Chart, Small Multiples, Stata
Bar Chart, Excel, Small Multiples
Excel, Interactive, Line Chart
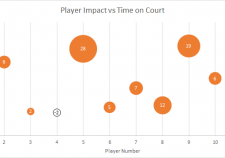
Blog Post, Bubble Chart, Excel
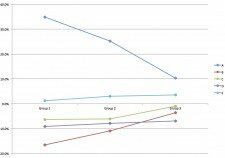
Excel, Line Chart, Slope Chart
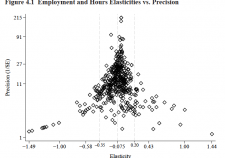
Excel, Scatterplot
Excel, Unknown
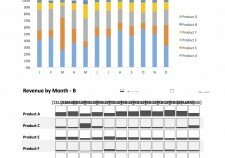
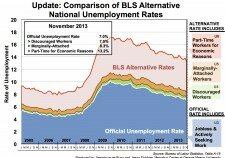
Area Chart, Excel
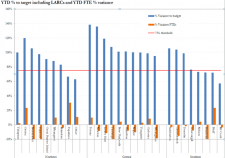
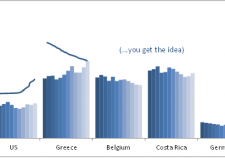
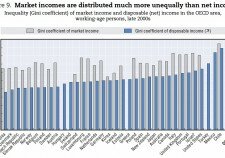
Bar Chart, Excel, Line Chart
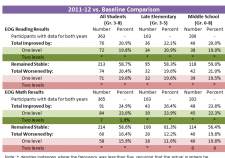
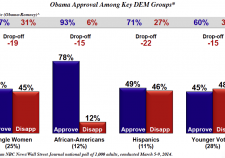
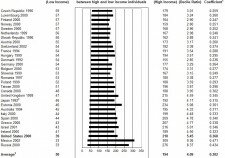
Bar Chart, Excel, Table