HelpMeViz

Helping people with everyday data visualizations

  • Home
  • How It Works

Recent Posts

  • Displaying Progress
  • Line or Column?
  • Fixing a Control Chart
  • Remake: Stacked Column Chart
  • JSON tree viewer in D3

HelpMe

Categories

  • Area Chart (1)
  • Bar Chart (5)
  • Blog Post (1)
  • Bubble Chart (5)
  • Choropleth Map (1)
  • Column Chart (9)
  • Hackathon (2)
  • Interactive (5)
  • Line Chart (8)
  • Map (3)
  • Moderator (3)
  • Pie Chart (2)
  • Remake Gallery (3)
  • Sankey (1)
  • Scatterplot (5)
  • Slope Chart (1)
  • Small Multiples (2)
  • Table (3)
  • Tools (31)
    • App (1)
    • d3 (4)
    • Excel (20)
    • Illustrator (1)
    • PowerPoint (1)
    • R (1)
    • Stata (3)
    • Tableau (1)
  • Tree Diagram (1)
  • Uncategorized (1)
  • Unit Chart (3)
  • Unknown (1)

Archives

  • January 2015
  • December 2014
  • November 2014
  • September 2014
  • August 2014
  • July 2014
  • June 2014
  • May 2014
  • April 2014
  • March 2014
  • February 2014
  • January 2014
  • December 2013
Follow

Monthly Archives: June 2014

8263904755_1207556585_m
+

Hackathon: Women’s Empowerment & Nutrition

Hackathon

12090497683_9096f4ccb1_m
+

Hackathon: Exposing Gaps in Data on Women’s Empowerment

Hackathon

Screen Shot 2014-06-17 at 6.19.12 PM
+

All Seeing Eye Chrome Extension

App

Institute color
+

The First HelpMeViz Hackathon Event

Moderator

Screen Shot 2014-06-02 at 9.36.51 PM
+

SNAP Participation & Outreach

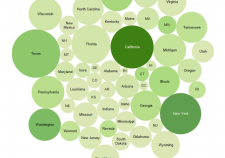
Bubble Chart, Tableau

MLBpayroll1
+

MLB Payroll and Wins

Bar Chart, Excel

Screen Shot 2014-06-02 at 9.49.19 PM
+

Urban, Population, Agriculture, and Land

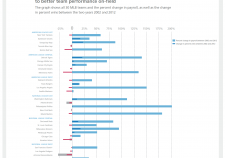
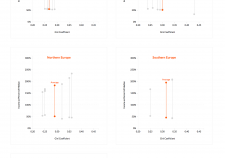
Bar Chart, Excel, Illustrator
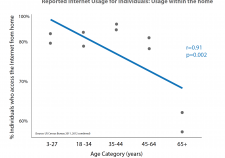
StarkaScatterplot
+

Plotting Internet Use

R, Scatterplot

Ripka_3
+

Cross-Country Inequality

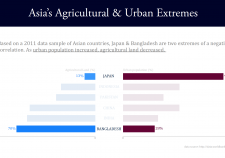
Interactive, Unit Chart

© Copyright 2014 HelpMeViz Proudly powered by WordPress | Theme: Gridster by ThemeFurnace.